Justice Atlas of Sentencing and Corrections:Mapping Incarceration, Community Reentry and Public Safety Costs Across 22 States
I am currently on a conference call for the unveiling of a terrific new resource called the Justice Atlas of Sentencing and Corrections. This is great day for data geeks and people interested in mapping incarceration.
Eric Cadora, founder of The Justice Mapping Center, hosted a national webinar to introduce the National Justice Atlas of Sentencing and Corrections, an online, interactive, mapping utility that provides academics, policy makers and the public a data-driven view of neighborhood patterns of imprisonment, community reentry, probation and parole and corrections spending.
For the first time, policy makers, researchers and the public will have access to in-depth statistics detailing disproportionate incarceration rates, parole and probation revocations, the removal and incarceration of parenting-aged men, and the millions of dollars spent neighborhood-by-neighborhood on imprisonment.
The site is easily navigated. For a quick example of information that is available, go to the site go to the “documents section” on the site and download PDF examples of specific Atlas Snapshots. They have collected data from 22 states. Data will be updated each year and they hope to expand to other states as well.
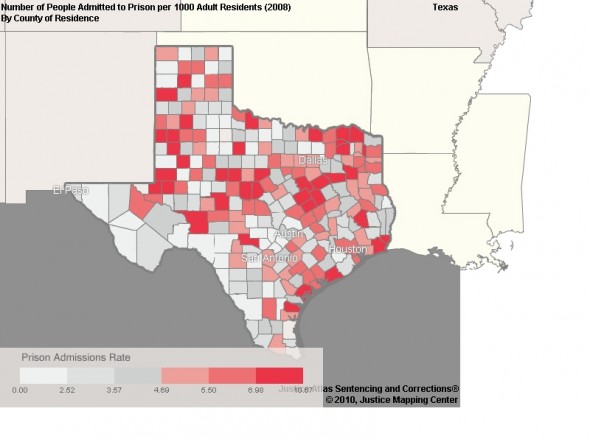
When you go to the site, click on the actual map on one of the states where data is available. It provides county by county data and zip code level data. There is a tutorial for those who need help to navigate the site. There is a great export function so that you can share your own custom maps. Below is an example of prison admissions rates in Texas as a map that I exported:
 This tool is absolutely fabulous and provides the level of data that many of us need on a neighborhood by neighborhood basis.
