Infographic: Costs of Incarceration and Execution
I won’t keep harping on how much I love data visualization because I am sure that this has become supremely boring for everyone.
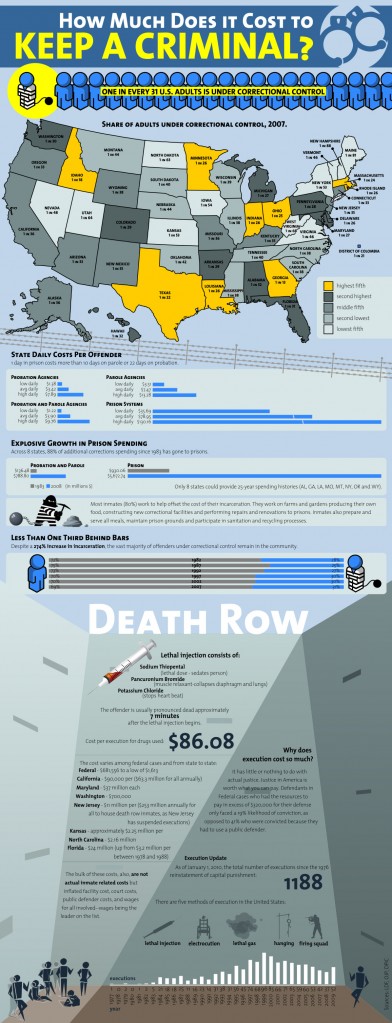
I recently came across this infographic illustrating the various costs related to incarceration (of course the human toll is immeasurable).
According to this infographic:
It costs an average of $3.42 a day to keep a prisoner on probation, and $7.47 to keep that same prisoner on parole. Compare that with how costly it is to keep prisoners locked up; it costs an average of $78.95 each day to keep a criminal behind bars.
Now, depending on the crime, you might think that cost is worth it to keep dangerous criminals off the street. Consider this, though: It costs more to keep someone in prison for one day that it costs to keep that person on parole or probation for 22.
It costs $86.08 to provide the drugs needed to perform a single lethal injection. Overall, executions are extremely costly to the states that perform them.
The average execution in California, for instance, costs $90,000. In Washington state, this cost stands at an even higher $700,000.
The death penalty has been even costlier in New Jersey. The state pays $253 million to house all of its death-row inmates each year. That’s because, as of the writing of this story, New Jersey had suspended its executions. Of course, it still has to do something with those death-row inmates.
States, though, aren’t cutting back on the amount of money they are spending on new prisons. Eight states, Alabama, Georgia, Louisiana, Missouri, Montana, Nevada, Oregon and Wyoming, have spent 88 percent of their additional corrections spending since 1983 on prisons.
Overall, based on 2007 data, one in every 31 adults in the United States is under correctional control. Georgia has the dubious distinction of leading the nation in the percentage of its residents under correctional control, one out of every 13.
Other states aren’t far behind. They include Idaho, one in 18; Texas, one in 22; Massachusetts, one in 24; Ohio, one in 25; and Minnesota, Indiana and Louisiana, all of which stand at one in 26.
The states on the other end of the spectrum include New Hampshire, with one out of every 88 adults under correctional control; Maine, one in 81; West Virginia, one in 68; Utah, one in 64; and North Dakota, one in 63.
About 80 percent of prisoners work while in prison to offset the costs associated with housing and feeding them. Most often, these prisoners work on farms and gardens to produce their own food or perform renovations and repairs on prisons. They also serve food to their fellow inmates, maintain the grounds and participate in their prison’s sanitation and recycling processes.
Click here for the full article and to see a larger version of the infographic.

